Table of Contents
Debug a Web Application
The Debug panel allows you to step through your code line by line, inspect variables, and watch expressions as your web application runs. This can be helpful for tracking down bugs and understanding how your code is working.
The Debug panel consists of the input and output sections. The input section shows the code that you test, and the output section evaluates as your code executes and shows the output results.
Debug Panel
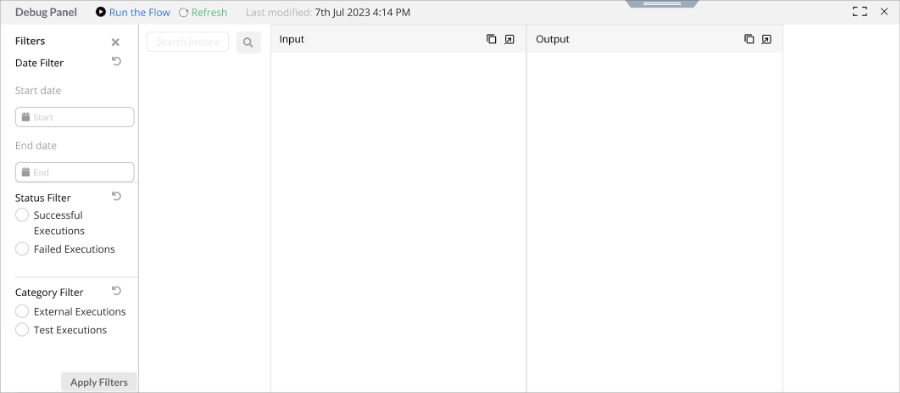
Debug Panel allows you to perform the following actions.
- Filter: Allows you to apply filters to select or display debug data that falls based on the below filter criteria.
- Run the Flow: Run the flow test.
- Refresh: Refreshes the Debug flow test.
- Search Bar: Use to search for a particular debug instance.
- Input: Shows the input details of the fed debug.
- Output: Shows the output details of the debug result.
To Create an integration
- Click on Debug from the top pane of the Business Logic Editor to open the Debug Panel.
- Click on Run the Flow to start the debug.
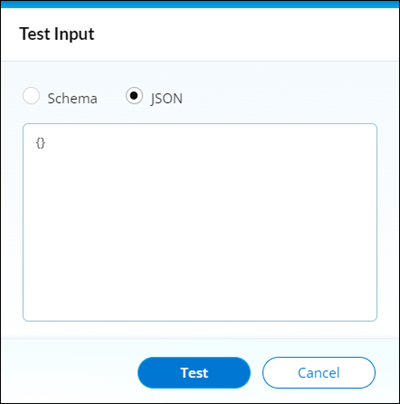
- In the Test Input dialog, add the Schema or JSON to perform the test.
- Click on Test to execute the test and see the result in Debug Panel.